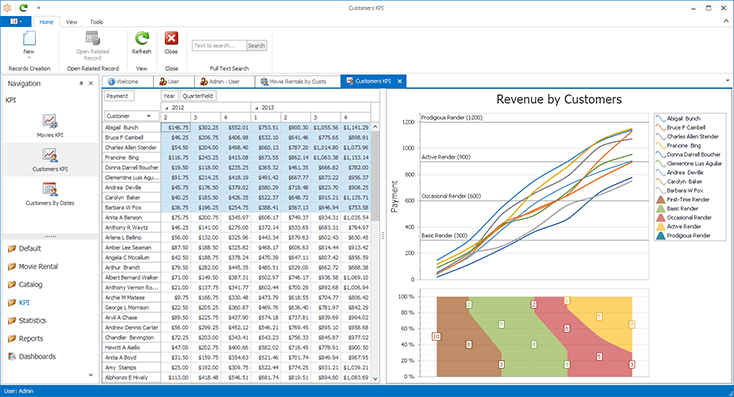
Key Performance Indicators (KPI) are quantitative measurements of dynamic business processes.
For instance, an important performance indicator for a trading company might be daily sales, and for a team of developers it might be the number of active bugs in their product.

For better visualization, KPI value ranges can be split into a "green zone" (everything is OK), a "yellow zone" (warning), and a "red zone" (things are problematic). When KPI are based on a time range, it can be useful to compare the values of different periods (for instance, the current month versus the previous month).
If a deeper analysis (drilldown) is required, then the objects from which an indicator was calculated can be listed with a simple double click.
The Key Performance Indicators (KPI's) module is infinitely flexible and allows for multiple measures to be visually presented on your customised screen as illustrated below when used in conjunction with a dashboard view.
